Visualisation SIG

Welcome to the homepage of the Visualisation Special Interest Group (VIS SIG)


Why are we here?

Innovation
  • To foster cultural change and increase the scope of data visualisation in the pharmaceutical industry
  • Explore and apply innovative (static and dynamic) data visualisation approaches (including ideas from other disciplines and industries)
What makes an effective Visualisation?
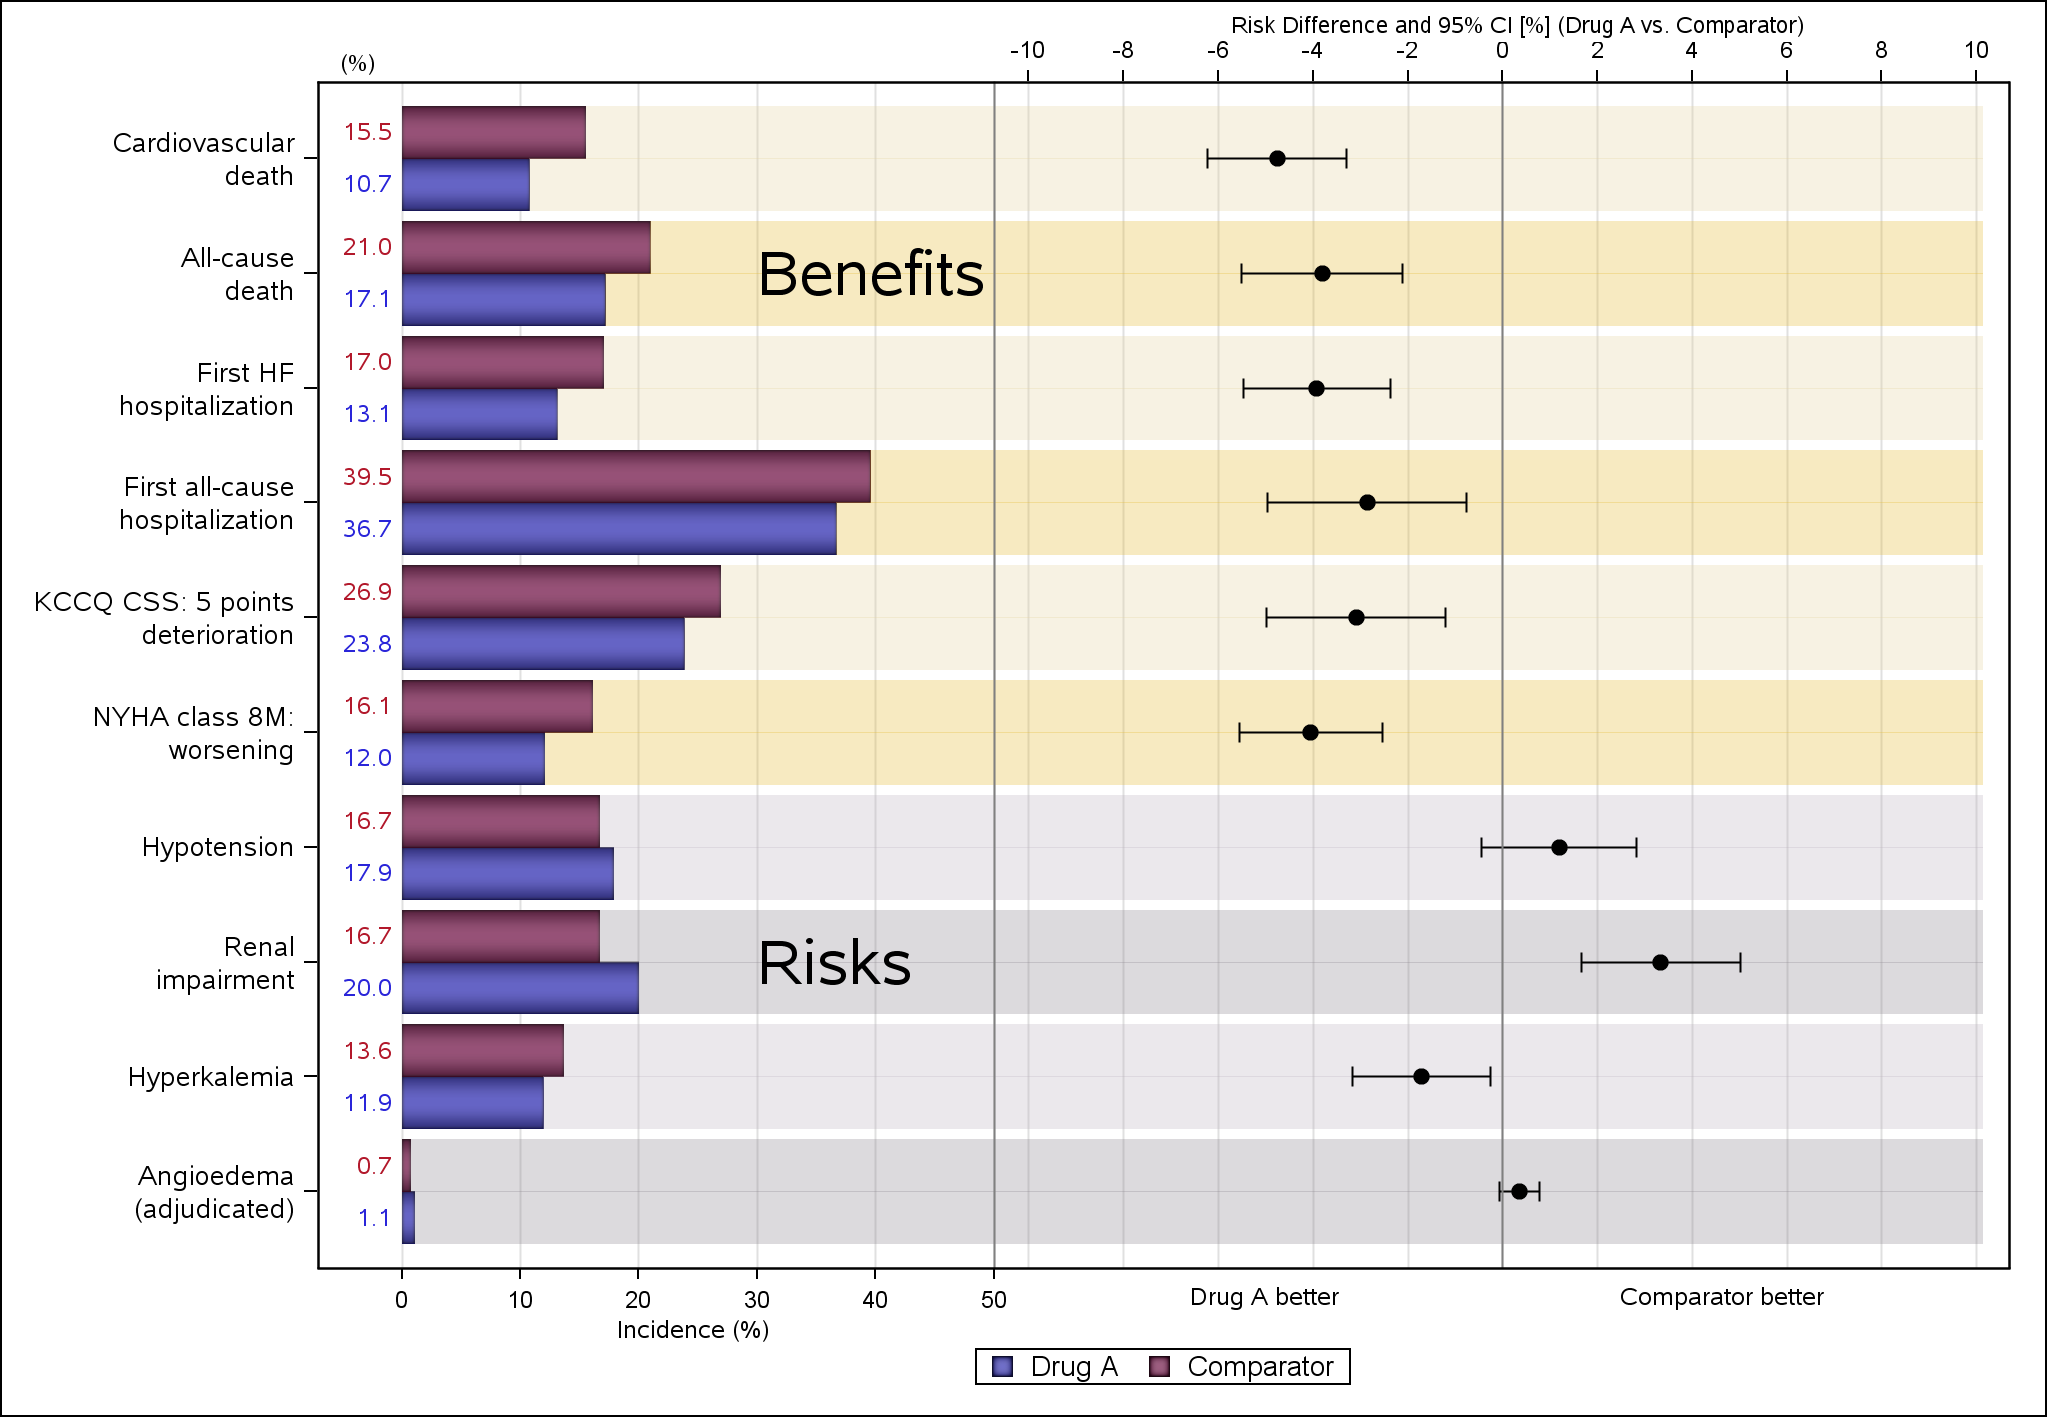
  • Exploring patterns and relationships in data
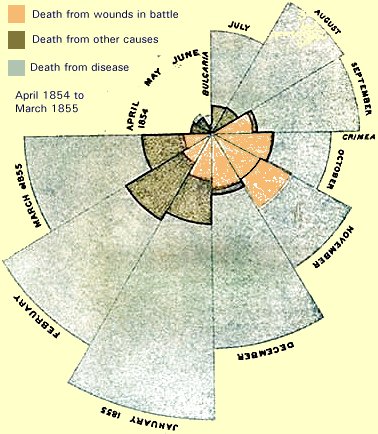
  • Informing and influencing stakeholders through effective 'storytelling'
  • Communicating uncertainty
Sharing
  • Library of examples from blog members
  • Regular blog feature

 
Library of Data Visualisation Resources

  • Graphics Principles
  • Galleries of graphics examples
  • Coding reference (R, SAS and python)
  • Technical information (e.g. colour theory)
  • Graphics blogs and podcasts

Click here for details.

Picture4

Wonderful Wednesdays

Our monthly webinar explores examples of innovative data visualisations relevant to our day to day work. Each month a new dataset is provided from a clinical trial or other relevant example, and participants are invited to submit a graphic that communicates interesting and relevant characteristics of the data.


This is a good opportunity to develop your knowledge by thinking through a practical example, practicing how to apply graphics principles, and developing your coding skills. Or you could just attend the webinar, view the submitted graphs and listen to the panel discussion.

Click here for more details


Picture4


How to get involved


Click here to join our mailing list and be informed of up-coming activities.
Click here if you would like to become an active member of the VIS SIG.


EFSPI_Logo

Upcoming Events

Latest Jobs